The Armchair Treasure Hunt Club
|
| This article first appeared in the June 2002 (issue 62) newsletter. Newsletters are sent
quarterly to all current members.
© 2002 all rights reserved. Reproduction is prohibited. |
| M |
The art of cartography, or map making, goes back many hundreds of years yet the core concepts have remained the same. The aim of a cartographer is simply to represent points on the Earth’s surface on a (normally) flat piece of paper to allow others to navigate around the Earth and understand the relationship between different points — whether those points are in different continents, different towns or just different rooms.
Although the concepts are broadly the same, there are a number of simplifications and assumptions that can be made when the cartographer reduces the size of the area being mapped. All club treasure hunts and most of the ones followed by club members are based in the UK, so with apologies to our overseas readers (but who might find what follows helpful in understanding the specifics of the UK system) I will focus on the mapping of the UK.
 Current, commercially available maps of the UK, at all scales, are based on map data provided by Ordnance Survey (OS). OS is a government agency that traces its roots back to the eighteenth century when George II commissioned a military survey of the Scottish highlands. As it name suggests, the need for maps was primarily a military one, initially, but once the value of maps had be proven, the consequences for other commercial activities was huge.
Modern maps are, to varying degrees, based on collating data from older maps and aerial photographs, laying them on top of one another and adjusting the results on the basis of modern surveying. Landscapes can change dramatically in a very short space of time, particularly in urban areas, so keeping maps up-to-date is an near impossible task.
From the 1930s, until recently, surveying techniques were based on triangulation. By attaching surveying equipment to points on the ground in the UK with known coordinates, the positions of features between the fixed points could be measured. This relied on a network of triangulation pillars dotted around the country. These trig pillars are typically around four foot high and constructed of concrete. They normally have a large threaded fitting on the top where a theodolite is inserted — a device used for measuring angles by sight. Although their use in modern mapping is limited, trig pillars are still a valuable tool for ramblers and map users and are denoted on an OS map by a small triangle symbol. Trig pillars are the one point on a map of any age, whose coordinates can be guaranteed. There were around 6000 pillars at one time, but they are no longer maintained and over a quarter have been removed by landowners or destroyed by natural events and accidents. Trig pillars are government property (although the land they are on often is not) and where a pillar is damaged to an extent that makes it unsafe or a hazard, OS are keen to be alerted so they can arrange the repair or removal of the pillar.
You might be surprised to learn that the accuracy of OS-based maps between trig points can be quite poor. Especially in urban areas. An error that might have crept into a map ninety years ago might still be in the modern map because industrial development has obscured boundaries or features whose position are known and can be used as reference points. For this reason it is important that we don’t rely heavily on the accuracy of coordinates at a scale of a few meters. Fortunately hunts rarely use coordinates at this low level.
The advent of the Global Positioning System (GPS) — of which more in the next newsletter — has given cartographers, access to accurate coordinates and mapping data simply by placing relatively small electronic satellite receivers at a point in the ground and (provided conditions in the sky are right) reading off an accurate coordinate — without the need to use sighting poles, tapes, theodolites and other bulky equipment. But significantly, the surveyor does not need to know where the nearest trig pillar is. The availability of this accurate data has brought about vast improvements in the accuracy of modern maps, but re-surveying the whole country is a big task, and will take many tens of years.
We all know the Earth is round (well there are a few non-believers, but I don’t think there are any amongst the club membership) and that OS maps are flat. In fact the earth isn’t an exact sphere — it is more pear shaped and slightly flatter at the poles. This irregular geoidal shape, as it is known, is a problem for cartographers, because there is no simple maths that will allow the surface of the earth to be represented accurately on a flat map. Fortunately these problems become less significant as the area you wish to map becomes smaller, and when we limit that to the UK, the relative curvature of the Earth is small so can be dealt with easily.
OS maps in the UK use a method of mapping the curved surface, well suited to a country that is ‘taller’ than it is wide, called the Transverse Mercator projection, and this allows us to place a regular grid on a map. I shan’t explain it here — suffice to say it results in a relative stretching of distance away from the equator, but is sufficiently small not to be a problem. Shapes and angles on such a map are largely accurate.
As well as the inaccuracy that arises from a flat map’s ‘projection’ of a curved surface, and the inaccuracy in obtaining the map data in the first place, the map user can introduce one major error of their own. A datum error.
Such errors are easy to avoid, by simply understanding how you obtained your coordinates. Datum errors are particularly important to watch out for when using maps from different sources or of different areas. GPS users should also be aware of what a datum is and how to use it.
Broadly speaking a Geodetic Datum is a set of rules that describe how numerical coordinates in a particular part of the world translate to the physical points on the globe. Typically these rules differ at different point around the world to best suite to area being mapped. Critically, two maps of the same area plotted using different Geodetic Datums (data is not an appropriate plural in cartographic terms!) will show different coordinates for any given place. But both will be right, so which should be used? It doesn’t really matter as long as you say which datum is being used when drawing a map and quoting coordinates. However, there is generally one common datums in use for all maps in a particular area of the world. For instance ED50 is the European Datum of 1950 and is, unsurprisingly, used in maps of Europe. The OSGB36 datum is a set of ‘rules’ established in 1936 and is used in all UK OS maps and their derivatives.
The advent of GPS has brought about the need for a world-wide datum, and WGS84 (World Geodetic System) is the standard. Most GPS receivers display their location to this datum (unless otherwise stated) and it is a common mistake for the proud British owner of a new GPS receiver to read his current coordinates from his GPS receiver and plot the point on an OS map, only to find himself about fifteen meters further southwest of where he thought he was standing. This is simply a datum inconsistency and converting the coordinates of the GPS receiver (WGS84) to the coordinates of the map (OSGB36) gives the correct result. Converting coordinates between datums is horribly complicated so most GPS receivers can do this for you.
There is another type of datum used for vertical (height) measurements and if absolute heights are important to you it is important to check the same datum is being used when communicating heights. On OS maps, the vertical datum is called the Newlyn datum and 0m is set at the mean sea level measured on the harbour wall at Newlyn in Cornwall between 1915 and 1921
When you draw (nearly) horizontal and vertical lines on a particular map projection and specify a geodetic datum, you end up with a grid system. This grid system is the basis for specifying map coordinates that everyone can understand and interpret. On UK Ordnance Survey maps, we call this system the National Grid. As mentioned above, it is based on the Transverse Mercator Projection and OSGB36 Geodetic Datum — quite a mouthful, but you will see those words at the bottom right of every OS Landranger or Explorer map. They are your assurance that we are all taking the same language. Any coordinate based on the National Grid will describe exactly the same point on any map based on OS data.
If you have a GPS receiver, and it is set to display National Grid (often abbreviated BNG = British National Grid) coordinates and the OSGB36 Datum, then those coordinates will describe your exact position on any OS map.
 A National Grid reference can take one of two common forms. The following coordinates describe exactly the same point:
SD 638 366
3638 4366
And they describe a point (Buckley Hall near Preston, Lancs) to within 100 meters.
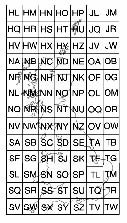
The first coordinate (SD 638 366) is the most common form and is sometimes known as the Landranger coordinate. The first two letters (SD) identify the part of the country. The National Grid splits the UK into a grid of squares 100km x 100km. Each square has a two letter identifier. North of Cumbria, the identifier begins with ‘N’ (NA, NB, NC, etc), South of Cumbria the prefix ‘S’ is used except for areas south east of the Humber where ‘T’ is used. The northern islands have their own ‘H’ prefix.
The second coordinate format is rarely seen in a leisure context but describes the same point by replacing the grid letter prefix by a 100km measurement from a ‘false’ zero point, off the coast of Cornwall. You can see the three digit groupings in the first reference become prefixed with a single digit (3 and 4) corresponding to the ‘SD’ National Grid square. These ‘full’ references are useful for helping understand the relative distance and position of points over 100km apart in the UK. For instance we can instantly see that Buckley Hall is about 360 km north and 430 km to the east of Cornwall.
I shall focus on the Landranger format as it is more commonly used in leisure activities such as orienteering or treasure hunting. But first let me dismiss a couple of variations on the same scheme. Sometimes the same point (Buckley Hall) might be quoted as:
Sheet 102: 638 366
Or
Preston & Blackpool: 638 366
Here, instead of quoting the National Grid prefix, we are being told which OS Landranger map (or ‘sheet’) to buy. In this case Sheet 102 ‘Preston, Blackpool & surrounding area’. It works as a way of specifying a point but is, strictly speaking, incorrect. OS Landranger sheets do not correspond exactly to the boundaries on National Grid squares. A National Grid square covers an area 100km x 100km, but a Landranger sheet only covers 40km x 40km. A Landranger map will typically cover the boundaries of two or possibly four National Grid squares. So although coordinates that reference a specific sheet are never ambiguous, they are unhelpful and should be avoided where possible.
 The numbers in a National Grid reference come in pairs. The first set of numbers tells us how far east (across) to go from the bottom left corner of the National Grid square. The second set tells us how far north (up). There should always be as many digits in the ‘easting’ as there are in the ‘northing’ and when using Landranger maps, there are normally three digits in each.
The number of digits determines the accuracy, or resolution, of a point. If just one digit in each direction is used, (e.g. SD 6 3) then an area 10km x 10km is being described — which might be fine for a large suburban borough or region. Two digits in each direction (e.g. SD 63 36) gives an area 1km x 1km — suitable to pinpoint a village or small town. The fine blue lines on an OS Landranger maps mark 1km grid squares and the two digit blue numbers are printed clearly along the edges and at 10km intervals throughout a Landranger map.
The usual pair of three-digit coordinates need to be determined by measuring or estimating the distance from the nearest blue lines to the left and below the point you wish to specify on a Landranger map. Divide each blue square into ten in each direction and estimate how many tenths away from the nearest blue line (below and to the left). If the point is eight tenths (16mm on the paper map) to the right of the vertical line numbered 63 and six tenths (12mm) up from the horizontal line numbered 36, then your grid reference becomes SD 638 366 and describes a point to within 100m. That is the smallest practical resolution on a Landranger maps and should be good enough to identify a large building.
Whilst a pair of four digit numbers would pinpoint a single house (10m x 10m) it would be hard to plot this accurately on a Landranger map, though may be of use to GPS users or if you are using street plans.
If you have trouble remembering which set of numbers go first (easting or northing) and which direction they go in, remember the schoolboy mnemonic. ‘Learn to walk (horizontal, left to right, west to east) before you learn to climb (vertical, up, south to north)’
 If you want to get familiar with the National Grid and the pink Landranger maps in particular, the best way is to buy one — larger bookshops or camping shops should sell them for around £6 or £8 each. Specialist retailers will be able to give you a free copy of the annually updated OS Mapping Index which splits the UK into two sides of a large sheet and shows how the various Landranger, Explorer and other OS maps cover the UK. The mapping index can easily be used to pinpoint two digit (1km) references such as SD 63 36.
Many public libraries carry a full set of Landranger maps, though sadly they are often very old and sometimes cannot be taken out of the library. To be sure the map is up to date, revision dates are shown in the bottom right of Landranger maps.
There are number of good UK mapping resources on the Internet
Ordnance Survey http://www.ordnancesurvey.gov.uk/ is the official OS site from where you can buy maps and find out more technical information.
If you want to see maps online, two notable sites will show 3km x 3km segments of the Landranger maps at a time by simply typing in a grid reference or place name. They also show more detailed street level maps and less detailed road atlas maps.
Streetmap http://www.streetmap.co.uk/
Multimap http://www.multimap.co.uk/